



Heat map: which lots buyers want
The master plan and unit chart get colored by buyer interest: views, favorites, leads and showings. Change prices and ads based on facts, not guesswork.
What’s new
A community master plan or a building’s unit chart is colored by buyer interest: views, favorites, leads, showings. You see how buyers move from a view to a deal. The section has a guided tour.
How it works
- 5shades of interest on the master plan and unit chart
- 19steps in the section’s guided tour
What it looks like
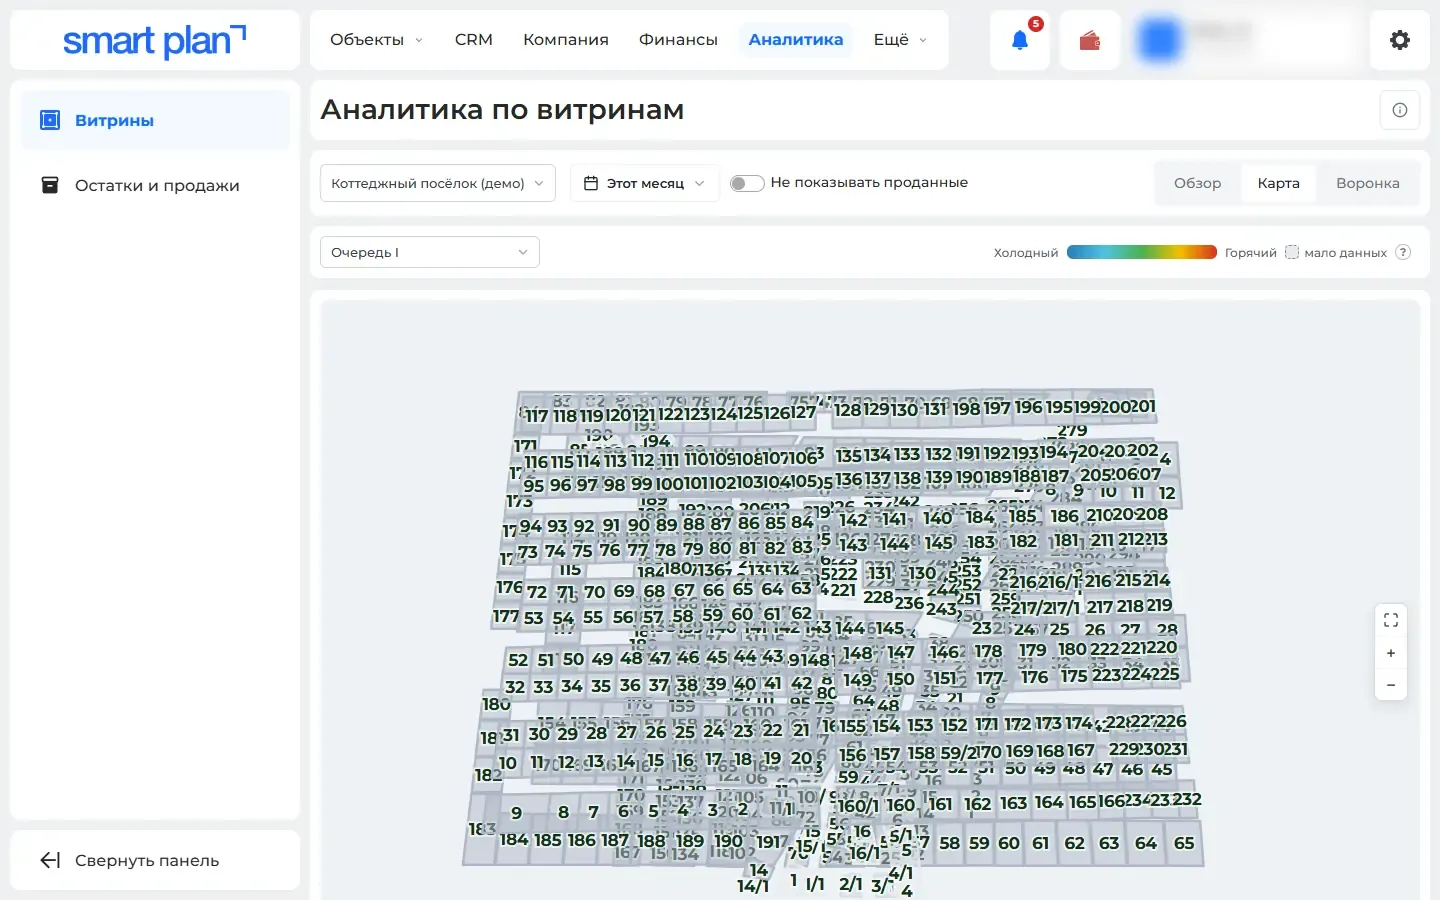
How to use it
- 1
Open "Analytics" («Аналитика») → "Showcases" («Витрины»).
- 2
Pick a property.
- 3
Switch between "Overview" («Обзор»), "Map" or "Unit chart" («Карта» or «Шахматка»), and "Funnel" («Воронка»).
- 4
Click a lot to see what its interest is made up of.
Setup help
We’ll help you set up and get the most out of the update
What we’ll do
- Set it up for your project
- Show your team how to use it
- Answer your questions
Setup help request